Experiment Setup
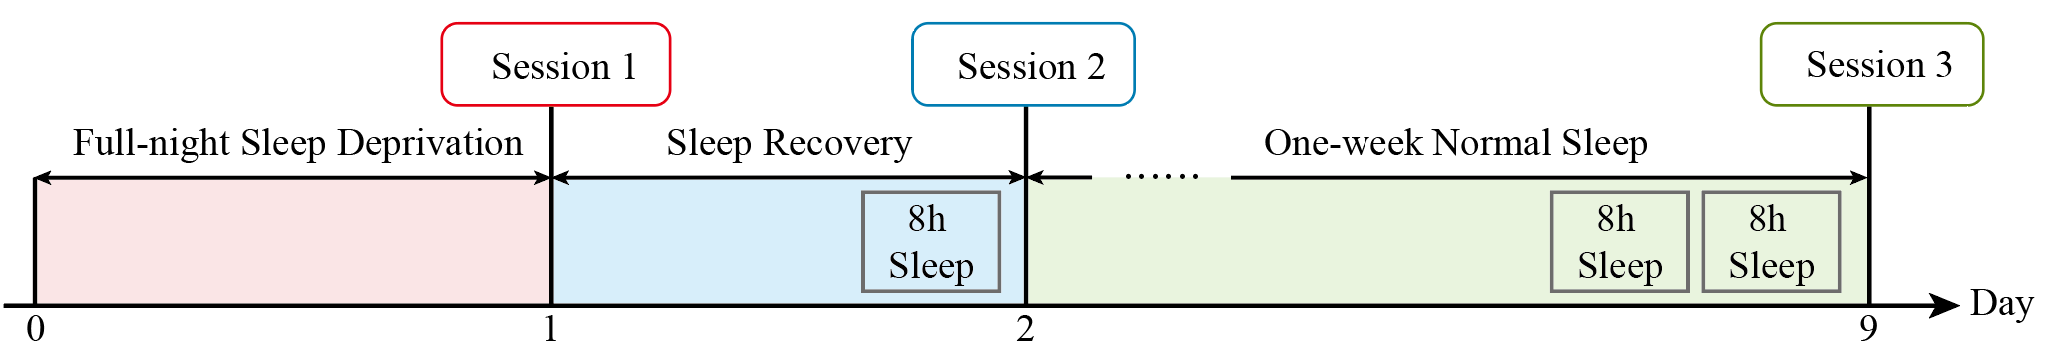
As shown in Figure below, participants were required to complete three experimental sessions under different sleep conditions: sleep deprivation, sleep recovery, and normal sleep.
During the experimental process, which lasted at least one week, participants were required to wear a Xiaomi smart band throughout to monitor their sleep patterns. Prior to each experimental session, the sleep duration recorded by the band was verified, and participants who did not meet the required sleep criteria were rescheduled for the experiment.
The first session was conducted following a complete night of sleep deprivation, during which participants were instructed to remain awake from the evening prior to the experiment until its conclusion in the following morning. Subsequently, participants were provided with an 8-hour sleep recovery period and completed the second session the next day under the SR condition. Finally, after at least one week of regular sleep, including at least two consecutive nights of 8 hours of sleep, participants underwent the third experimental session.
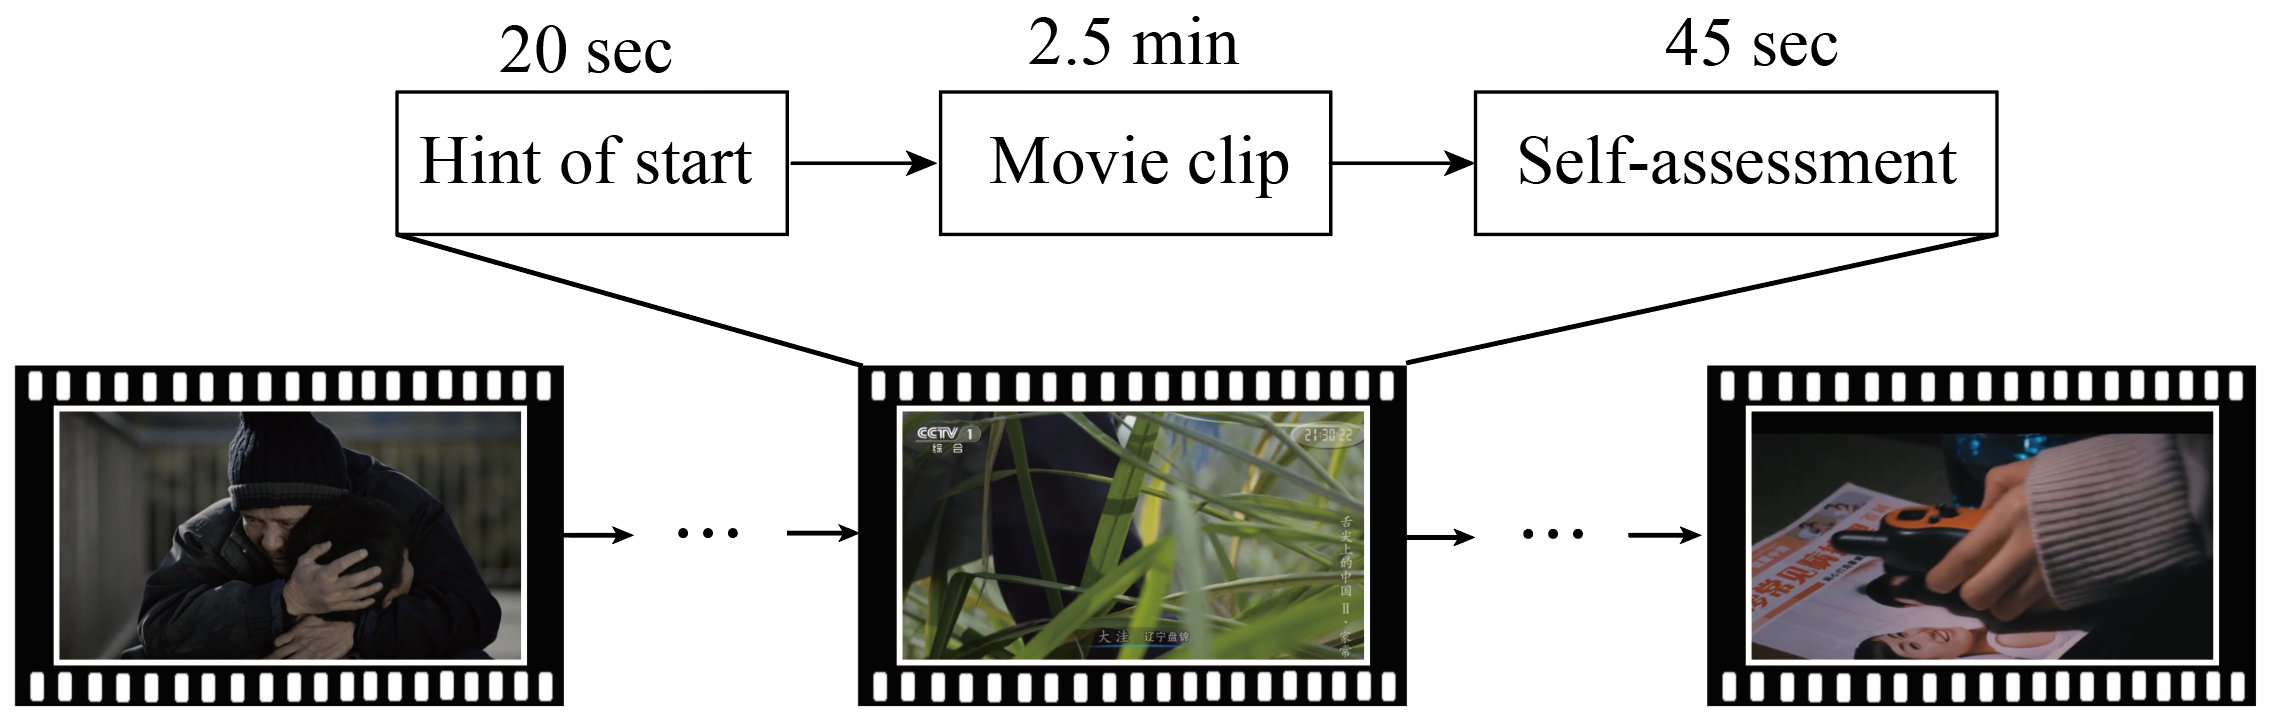
In each session, participants were required to watch 24 video stimuli, which included four emotional categories: happiness, sadness, fear, and neutral state. Each emotion category consisted of 6 video clips, with each clip lasting approximately 2.5 minutes. The stimuli for each session were consistent with those used in the SEED-IV dataset.
Prior to each movie clip, a 20-second hint was presented, which included the emotion category and a brief overview of the video's content. Participants were instructed to maintain authentic emotional responses throughout the video viewing. Following the completion of each video, participants were given approximately 45 seconds to assess the emotional intensity they experienced, rating it on a scale from 1 to 5.
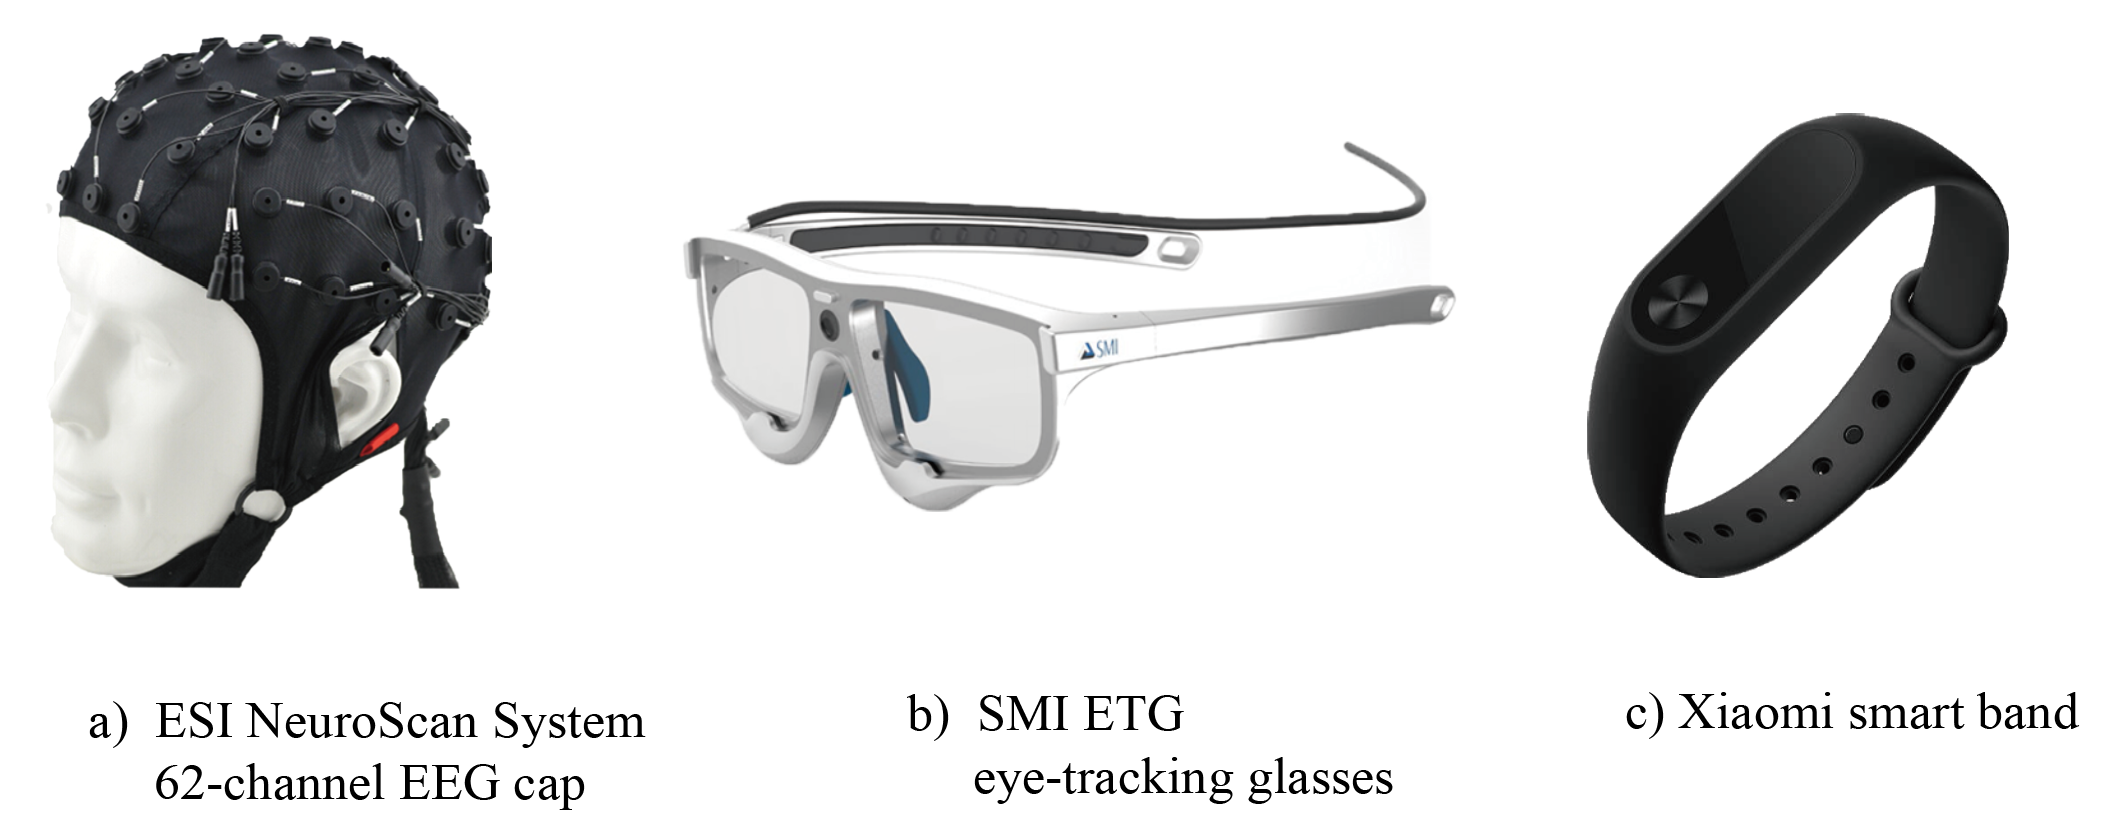
During the experiment, each participant wore a wet EEG cap from the ESI NeuroScan system and SMI ETG eye-tracking glasses.
Subjects
40 healthy individuals (20 males and 20 females), aged between 18 and 32 years, were recruited from Shanghai Jiao Tong University. All participants were physically healthy, with no history of mental illness or disorders. They had normal or corrected vision and maintained a regular sleep-wake cycle, averaging 7 to 8 hours of sleep per night. Participants were screened using the Pittsburgh Sleep Quality Index (PSQI), with only those scoring below 10 included in the study.
Feature Extraction
EEG Features
EEG signals are often contaminated with various artifacts, such as head and body movements, powerline interference, and other physiological signals. These artifacts can significantly impact the accuracy of subsequent analyses.
To mitigate this issue, we utilized Curry 7 software to remove irrelevant artifacts from the collected EEG data. The baseline correction was performed first. Then, a 1-70 Hz bandpass filter was applied to remove high-frequency noise (e.g., EMG) and a 50-Hz notch filter was used to eliminate powerline interference.
To further improve the quality of the EEG signals, we employed principal component analysis (PCA) to remove artifacts caused by eye blinks. We manually selected the eye blink duration based on the VEO signal for each subject in Curry 7. The PCA algorithm was subsequently applied to the EEG data, and we visually inspected the signals to ensure their quality. Finally, we used the MNE package in Python to discard useless channels and resampled the EEG signals from 1000 Hz to 200 Hz to reduce computational complexity while maintaining the integrity of EEG critical frequency bands (δ:1~4 Hz;θ:4~8 Hz;α:8~14 Hz;β:14~31 Hz;γ:31~50 Hz).
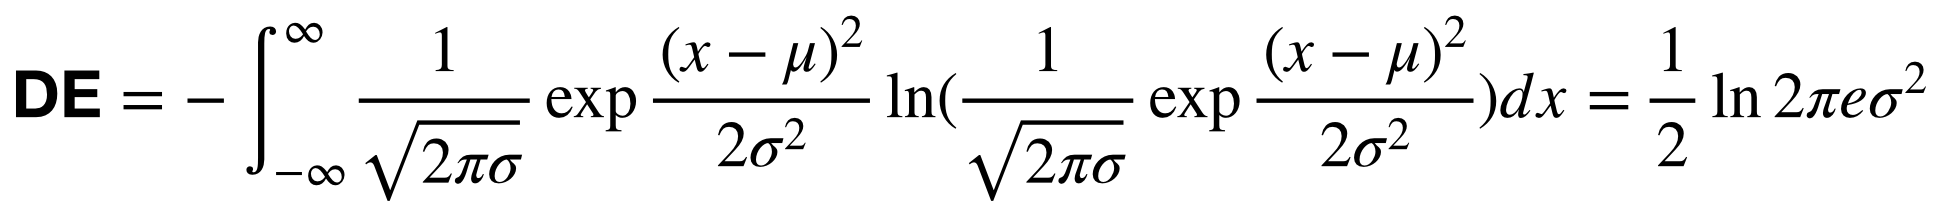
Differential Entropy (DE) features were extracted using Short-Time Fourier transform (STFT) with 4-s nonoverlapping Hanning windows. The final dimensionality of the DE features was 310. DE features were smoothed by the linear dynamic system (LDS) approach.
We assume that the EEG signals obey a Gaussian distribution:
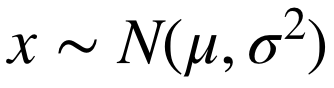
.
Then, the calculation of the DE features can be simplified:
Eye Movement Features
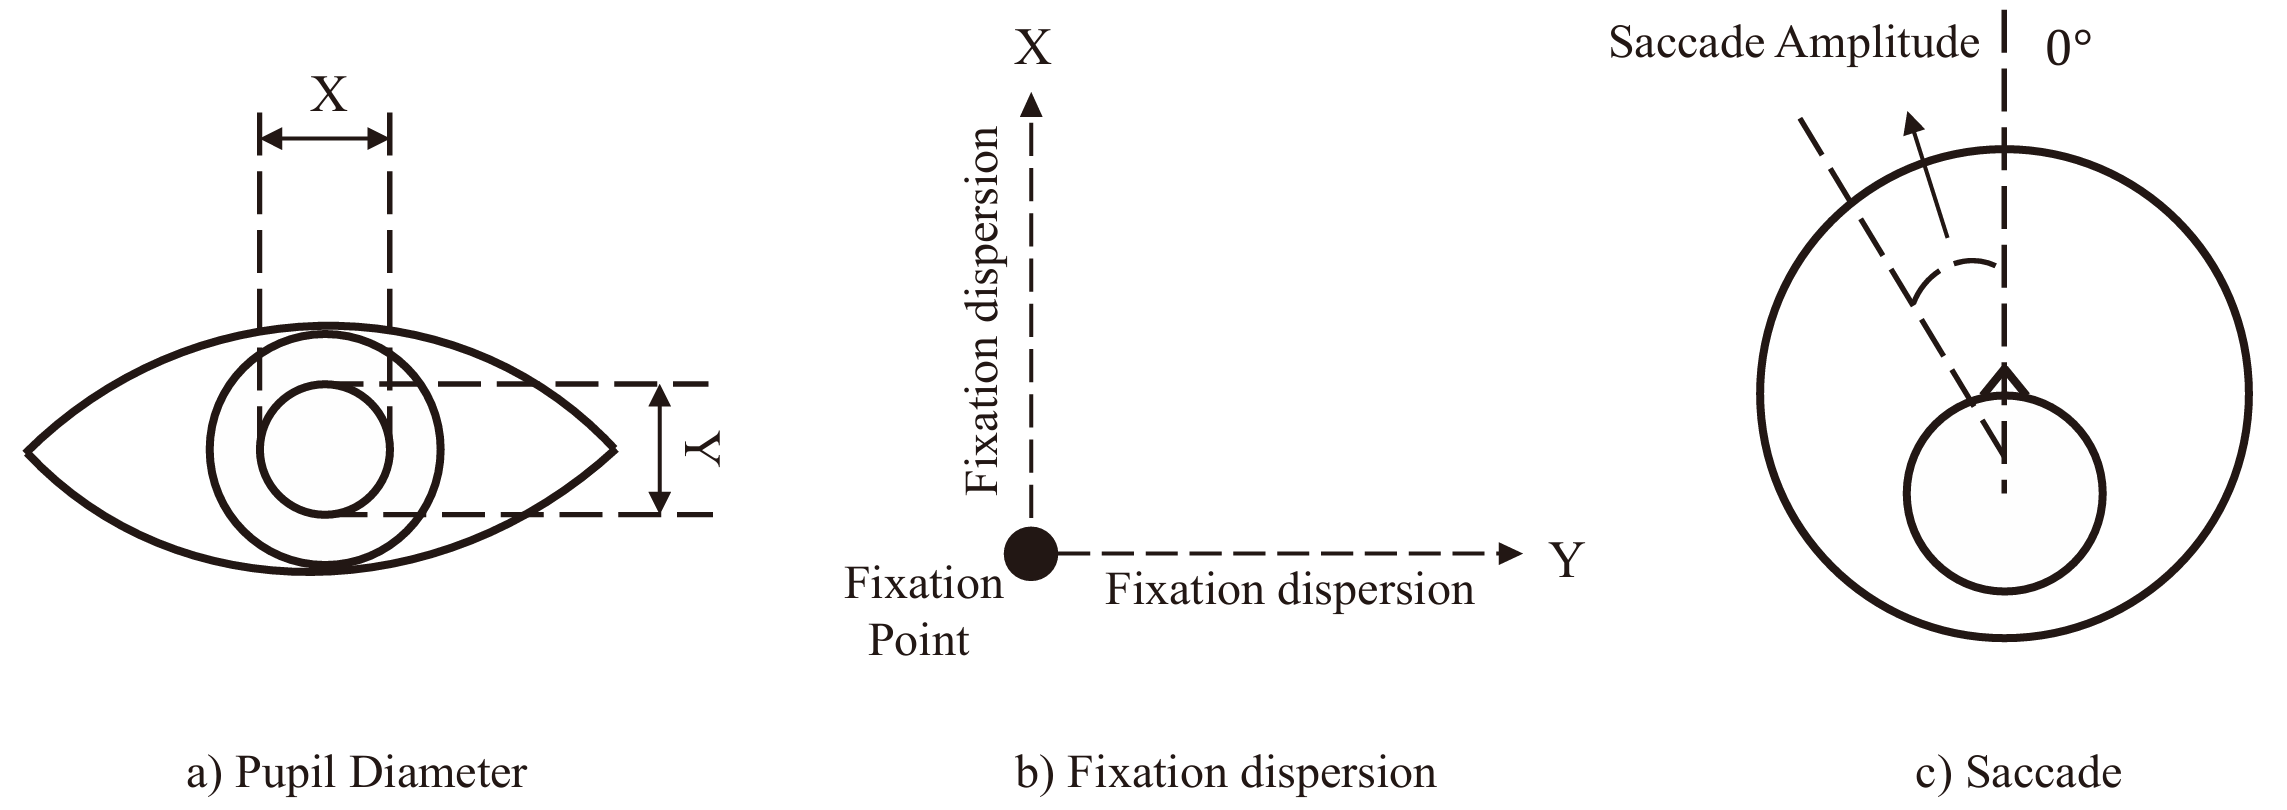
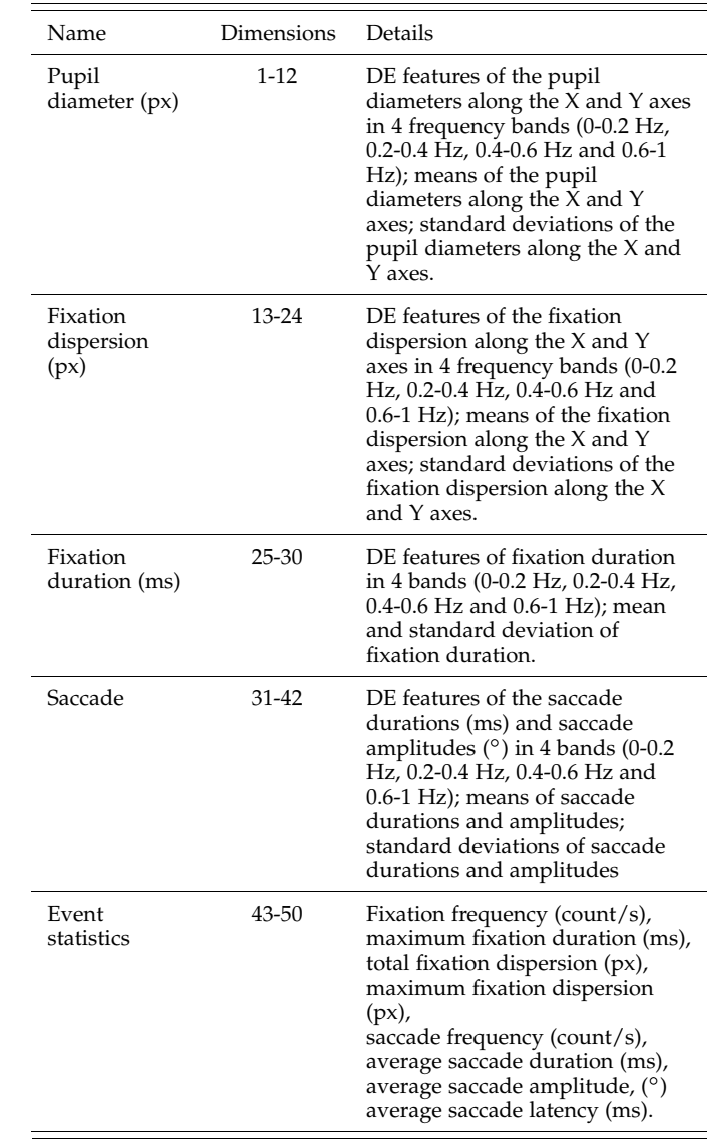
We extracted 50 eye movement features from the data provided by Begaze, a software designed for analyzing eye images produced by eye-tracking glasses. Four categories of eye movements were included: pupil diameter, fixation dispersion, fixation duration and saccades:
A detailed list of eye movement features is shown below.
Dataset Summary
-
For data partitioning and feature loading methods, please refer to the code in the config folder and dataset.py file.
-
Each data folder contains three subfolders named "session_1", "session_2", and "session_3". "session_1" contains data from the sleep deprivation condition, "session_2" contains data from the sleep recovery condition, and "session_3" contains data from the normal sleep condition. All data files follow the naming convention "subID_date", where date represents the acquisition date (e.g., "sub1_20201114" indicates data collected from the first participant on November 14, 2020).
-
Folder "eeg_features":
This folder contains DE features (.npy files) for 40 participants.
Each .npy file contains keys named as "CLIP_clipID" (e.g., "CLIP_1" represents DE features for the first video clip). The feature dimensions are: sample*5(frequency)*62(channel).
-
Folder "eeg_raw":
This folder contains raw EEG data (.cnt format) collected using the Neuroscan system with a 1000 Hz sampling rate. It includes two subfolders: "part1" contains data from 24 participants, and "part2" contains data from 16 participants. The two datasets differ in video stimulus segmentation timing. Specific clip start/end times (in seconds) can be found in the code configuration file (start_end_time parameter in config/global.yaml).
-
Folder "eye_features":
This folder contains extracted eye movement features (.npy files).
Each .npy file contains keys named as "CLIP_clipID" (e.g., "CLIP_1" represents features for the first video clip). The feature dimensions are: sample*50.
-
Folder "eye_raw":
This folder contains xlsx files extracted from the eye-tracking device.
-
File "channel_62_pos.locs":
This file contains spatial position information for the 62 electrodes, readable using the MNE package.
-
File "channel-order.xlsx":
This file specifies the arrangement order of the 62 electrodes for DE features.
-
File "SEED-SD_stimulation.xlsx":
This file contains information about the stimulus materials.
Download
 Download SEED-SD
Reference
If you feel that the dataset is helpful for your study, please add the following references to your publications.
Ziyi Li, Le-Yan Tao, Rui-Xiao Ma, Wei-Long Zheng and Bao-Liang Lu, Investigating the Effects of Sleep Conditions on Emotion Responses with EEG Signals and Eye Movements,
IEEE Transactions on Affective Computing, 2025.
[BibTex]