Experiment Setup
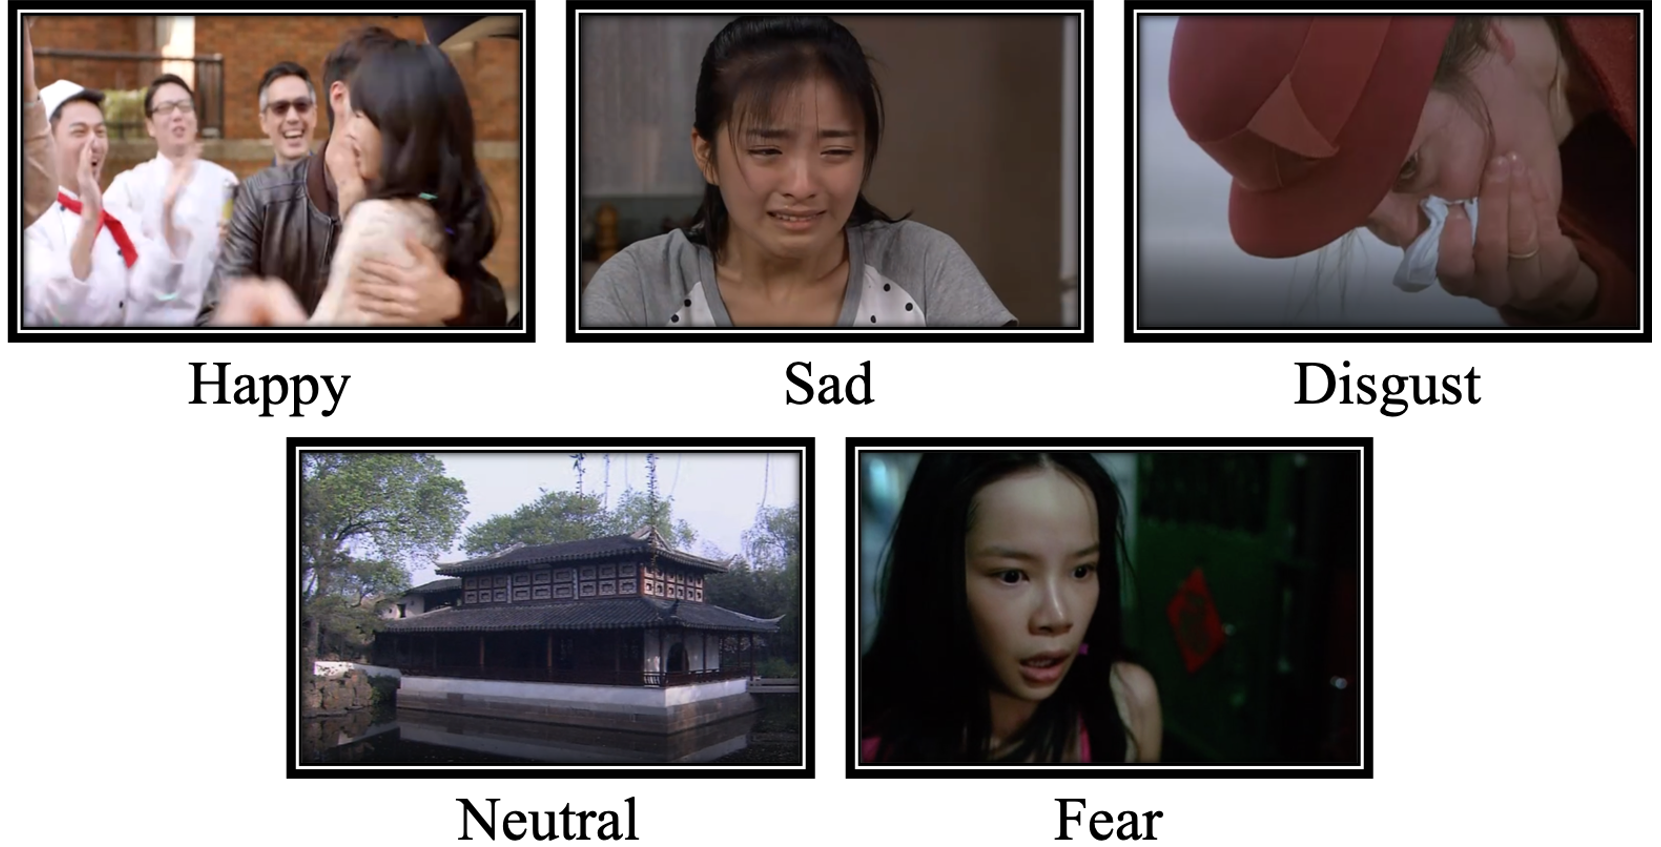
The emotion induction method adopted in this experiment is stimulus material induction, in other words,
it is generated by allowing the subjects to watch specific emotional stimulus materials to achieve the
purpose of inducing the subjects' corresponding emotional state.
|
|
|
|
To study the stability of emotion recognition and ensure the effectiveness of the stimulation,
each subject was asked to participate in the experiment three times, with at least three days
between experiments. The subjects in each experiment needed to watch 15 pieces of stimulating
material and 3 pieces of each type of emotion. At the same time, to ensure the effectiveness
of the stimulus and prevent the subjects from being bored, the materials viewed by the subjects
in the experiment were completely different each time, and the total time for viewing the
materials in each experiment was controlled to approximately 50 minutes.
In one trial, the participant watched one of the film clips, while his or her EEG signals and eye movements were collected
with a 62-channel
ESI NeuroScan System and
SMI eye-tracking glasses.
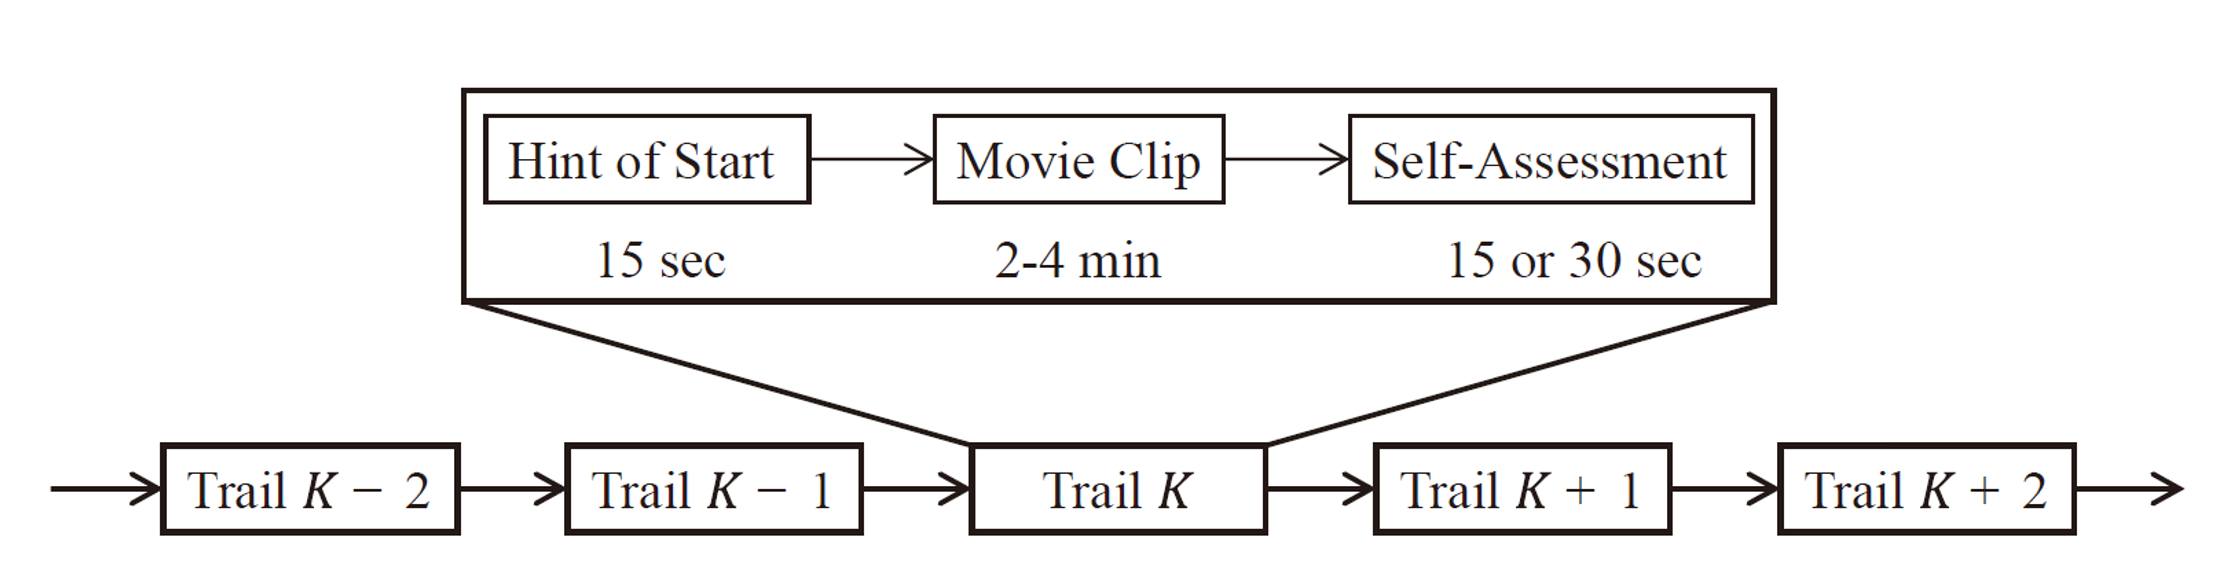
All stimulus materials have 15 seconds before playing to introduce the background of the materials
and the emotions they want to induce. After the stimulus materials are played, there will be 15 seconds
or 30 seconds of self-evaluation and rest time according to the type of material. If the type of stimulus
material was disgust or fear, the rest time was 30 seconds, and the time for happiness, neutrality and
sadness was 15 seconds. The specific process is shown in the figure below.
|
|
|
|
In the self-assessment section, the subjects were asked to score according to the induction effect
of the stimulus material. The scoring range was 0-5 points, of which 5 points represented the best
induction effect and 0 points the worst. If the participant feels joy after watching the joy video,
they should be scored 4-5 points, and if they do not feel anything, they should be given a score of 0.
It is worthwhile to mention that if you are watching neutral stimulus material,
if the subject's mood fluctuates, the score should be 0, and the natural state is 5 points.
Subjects
This experiment collected data from 16 subjects, including 6 males and 10 females.
All subjects were recruited through social platforms and were students of Shanghai
Jiao Tong University with normal hearing and vision, a right-handed dominant hand, and a
stable mental state. Subjects will receive an Eysenck EPQ personality test after
expressing their intention to participate in the experiment through social platforms.
Feature Extraction
EEG Features
For EEG signal processing, the raw EEG data are first downsampled to a 200 Hz sampling rate.
To filter the noise and remove the artifacts, the EEG data are then processed with
a bandpass filter between 1 Hz and 75 Hz.
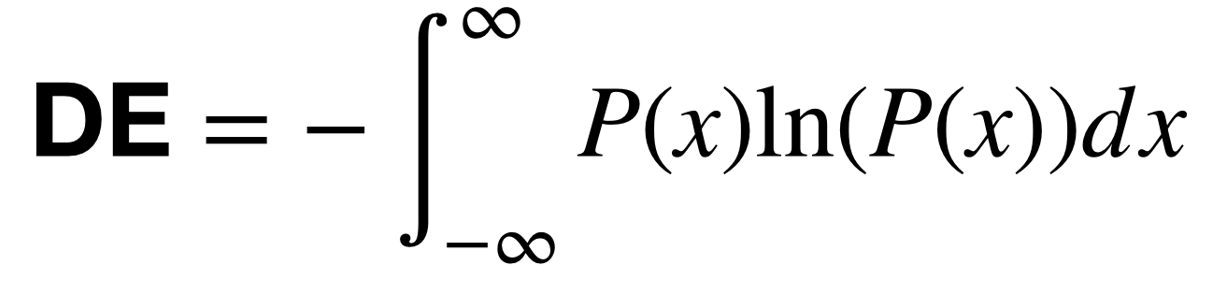
Afterward, we extract differential entropy (DE) features
within each segment at 5 frequency bands: 1) delta: 1~4 Hz;
2) theta: 4~8 Hz; 3) alpha: 8~14 Hz; 4) beta: 14~31 Hz; and
5) gamma: 31~50 Hz.
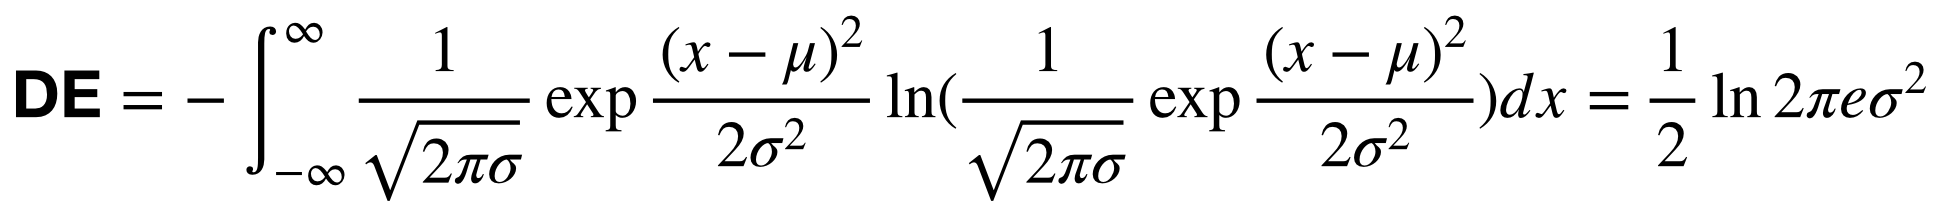
We assume that the EEG signals obey a Gaussian distribution:
.
Then, the calculation of the DE features can be simplified:
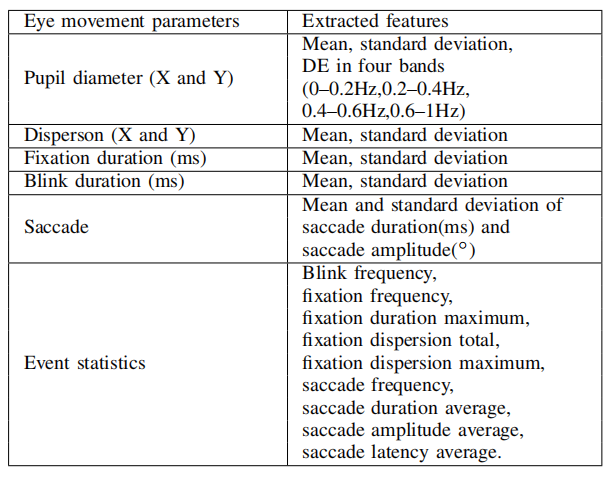
Eye Movement Features
For the eye movement information collected with the SMI eye tracking glasses, we extracted various features from
different detailed parameters used in the literature, such as the pupil diameter, fixation, saccade, and blink.
A detailed list of eye movement features is shown below.
Dataset Summary
-
Folder EEG_DE_features:
This folder contains DE features of 16 participants and a
Jupyter notebook file giving example code to load the data. Feature
data are named in "subjectID_sessionID.npz". For example, file "1_123.npz"
means that this file is the DE feature for the first subject, and the DE features
from three sessions are included.
-
Folder EEG_raw:
This folder contains raw EEG data (.cnt file) collected with
the Neuroscan device and a Jupyter notebook file giving example code to load
the data. Raw data are named in "subjectID_sessionID_date.cnt" format. For
example, "1_1_20180804.cnt" means that this is the raw data of the first
subject and first session. **Notice: session numbers are given based on the
stimuli materials watched, not based on the time. **
-
Folder Eye_movement_features:
This folder contains extracted eye movement features.
-
Folder Eye_raw:
This folder contains Excel files extracted from the eye tracking device.
-
Folder src:
This folder contains two subfolders "DCCA-with-attention-mechanism" and
"MultualInformationComparison", which are DCCA models and mutual information
calculating code used in the paper "W. Liu, J. -L. Qiu, W. -L. Zheng and B. -L. Lu,
"Comparing Recognition Performance and Robustness of Multimodal Deep Learning
Models for Multimodal Emotion Recognition," in IEEE Transactions on Cognitive
and Developmental Systems, doi: 10.1109/TCDS.2021.3071170."
-
File trial_start_end_timestamp.txt:
This file contains the start and end times of the stimulus movie clips.
-
File emotion_label_and_stimuli_order.xlsx:
This file contains the emotion labels and stimuli orders.
-
File Participants_info.xlsx:
This file contains meta-information of the subjects.
-
File Scores.xlsx:
This file contains feedback scores of the participants.
Download
 Download SEED-V
Reference
If you feel that the dataset is helpful for your study, please add the following references to your publications.
Wei Liu, Jie-Lin Qiu, Wei-Long Zheng and Bao-Liang Lu, Comparing Recognition Performance and Robustness of Multimodal Deep Learning Models for Multimodal Emotion Recognition,
IEEE Transactions on Cognitive and Developmental Systems, 2021.
[link]
[BibTex]