Experiment Setup
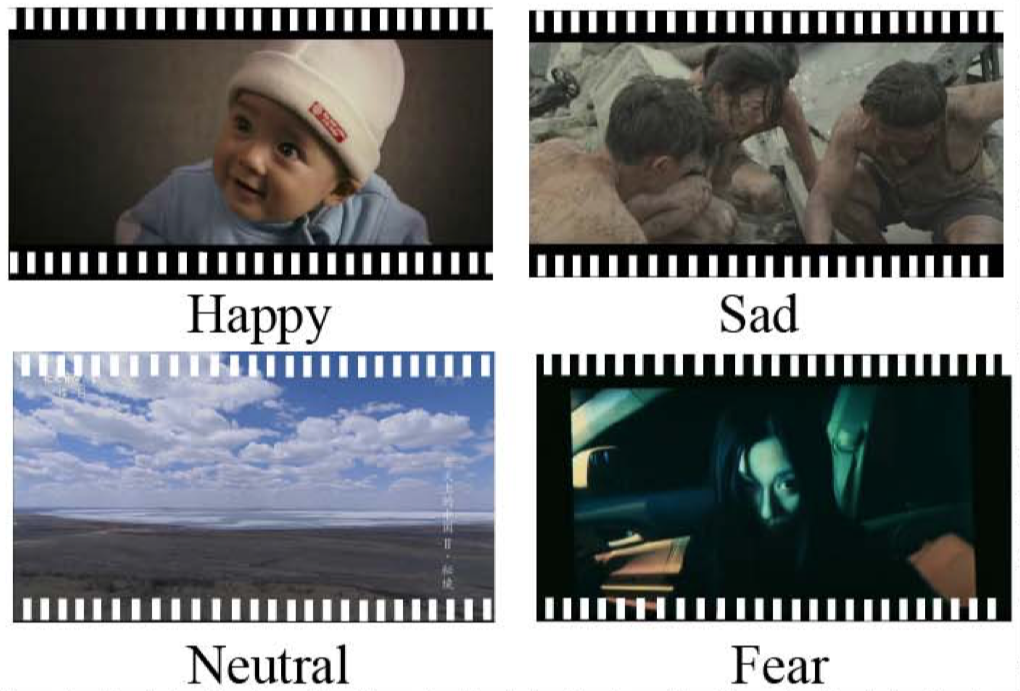
Seventy-two film clips were carefully chosen by a preliminary study, which had the tendency to induce happiness, sadness, fear or neutral emotions.
A total of 15 subjects participated in the experiment.
For each participant, 3 sessions were performed on different days, and each session contained 24 trials.
In one trial, the participant watched one of the film clips, while his or her EEG signals and eye movements were collected
with the 62-channel
ESI NeuroScan System and
SMI eye-tracking glasses.
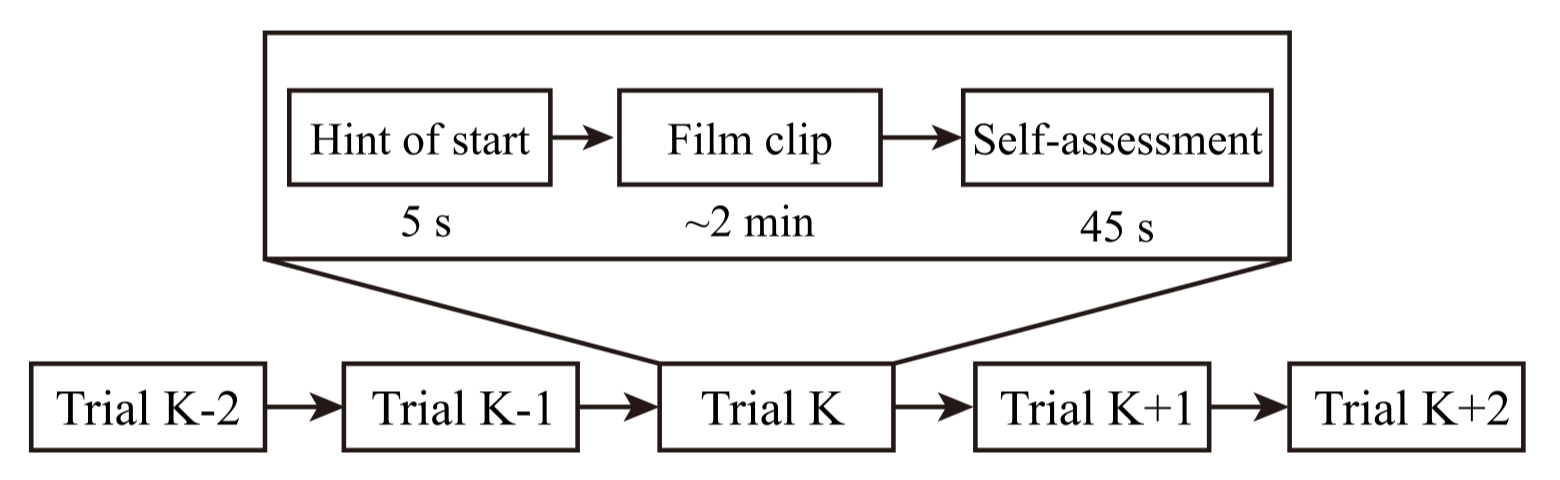
A schedule diagram of the trial is as follows.
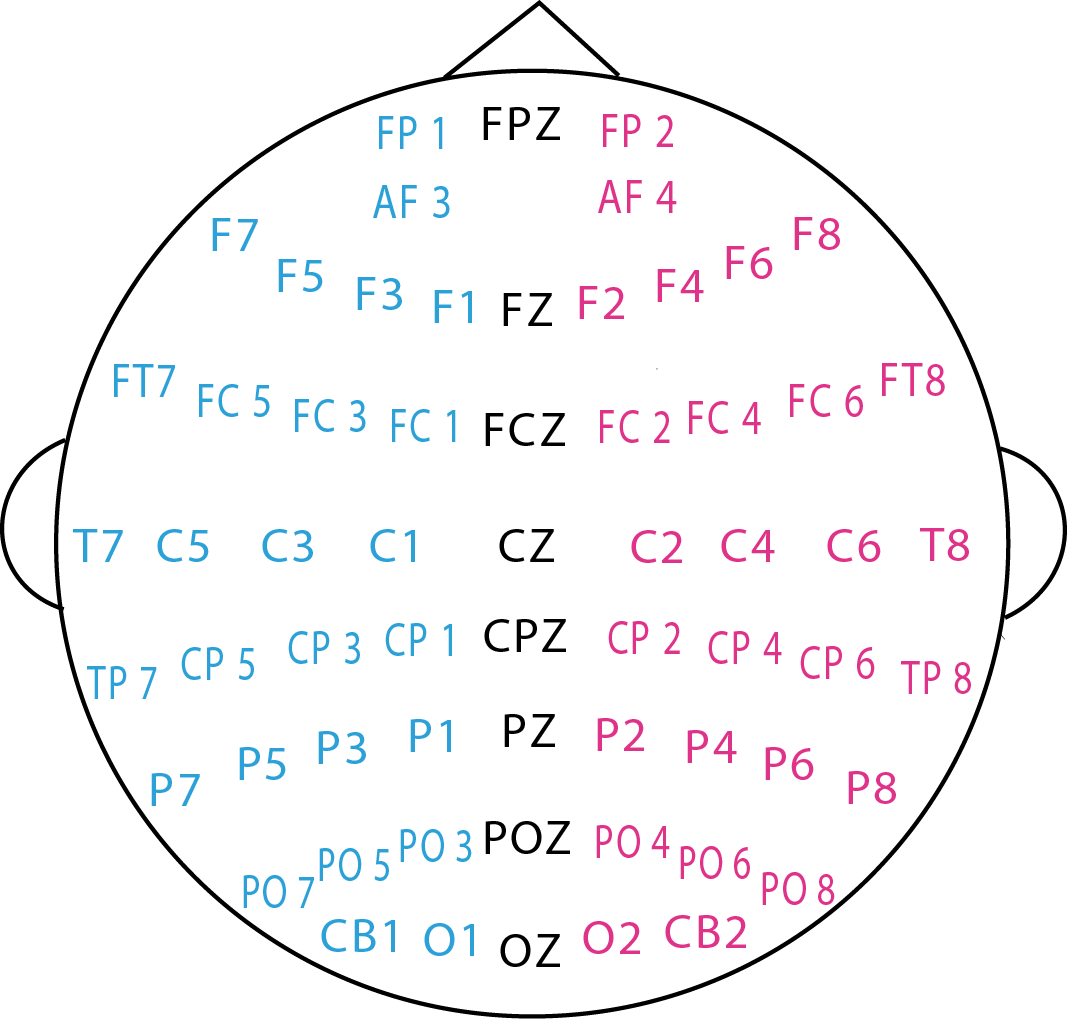
The experimental scene and the corresponding EEG electrode placement are shown in the following figures.
Feature Extraction
Each session is sliced into 4-second nonoverlapping segments.
Each segment is regarded as one data sample during the model training.
EEG Features
For EEG signal processing, the raw EEG data are first downsampled to a 200 Hz sampling rate. To filter the noise and remove the artifacts, the EEG data are then processed with a bandpass filter between 1 Hz and 75 Hz. Afterward, we extract power spectral density (PSD) and differential entropy (DE) features
within each segment at 5 frequency bands: 1) delta: 1~4 Hz; 2) theta: 4~8 Hz; 3) alpha: 8~14 Hz; 4) beta: 14~31 Hz; and 5) gamma: 31~50 Hz.
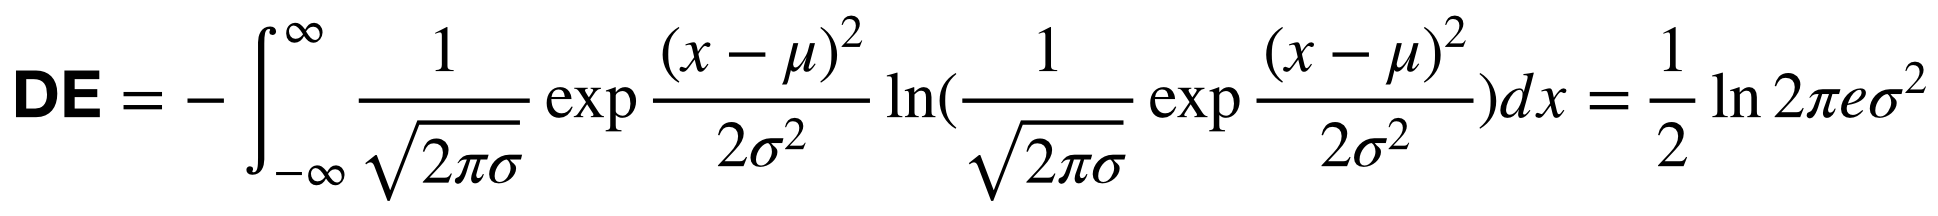
The calculation of PSD and DE of a random variable

is
We assume that the EEG signals obey a Gaussian distribution:
.
Then, the calculation of DE features can be simplified:
Eye Movement Features
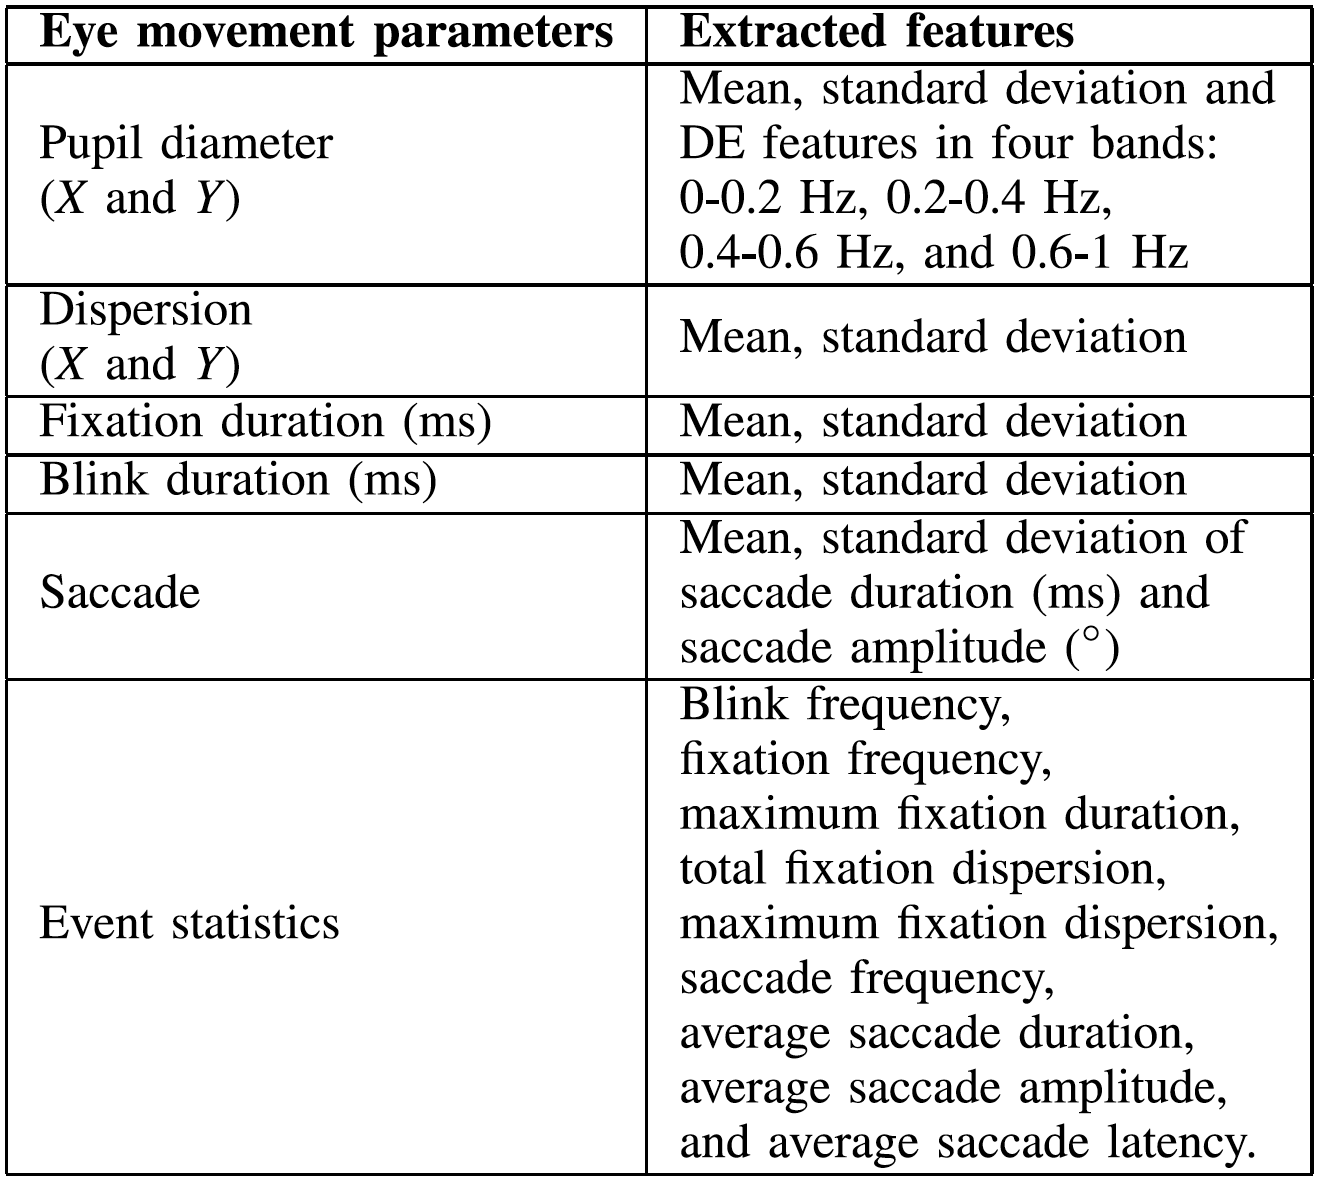
For the eye movement information collected with the SMI eye tracking glasses, we extracted various features from
different detailed parameters used in the literature, such as the pupil diameter, fixation, saccade, and blink.
A detailed list of eye movement features is shown below.
Dataset Summary
You can find four folders and 2 files in the dataset folder.
-
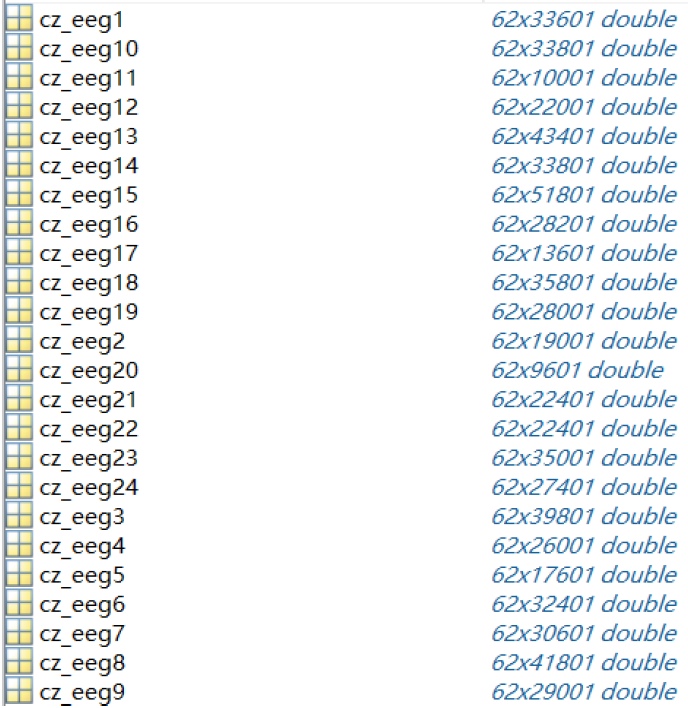
The "eeg_raw_data" folder contains the raw EEG signals of the 15 participants. The inner 3 folders named '1', '2' and '3' correspond to the 3 sessions.
Each ".mat" file (named with {SubjectName}_{Date}.mat) in the folders stores a structure with
fields named "cz_eeg1", "cz_eeg2", ... , "cz_eeg24", which correspond to the EEG signals recorded during
the 24 trials. The architecture of one of the files is shown below.
-
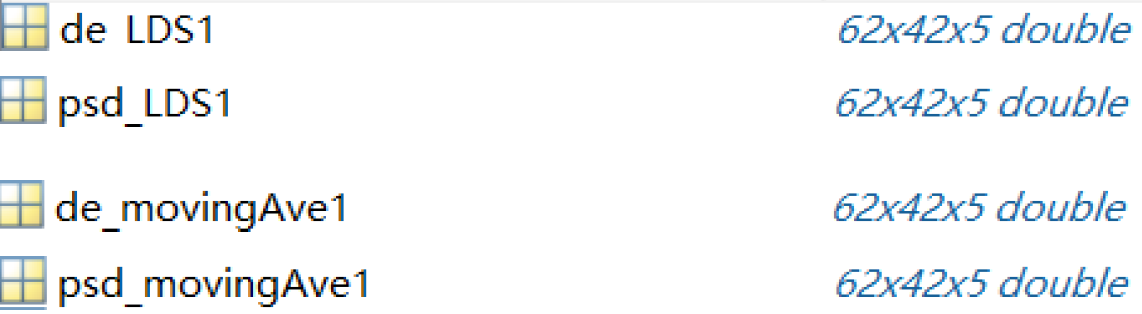
The "eeg_feature_smooth" folder has the same structure as in eeg_raw_data. Each ".mat" file stores a structure
with fields named "{X}_{Y}{Z}". The "X" indicates the type of feature, which can be "psd" or "de". "Y"
indicates the type of smoothing method, which can be "movingAve" or "LDS".
Linear dynamic system (LDS) and moving averages are two different approaches to filter out noise and
artifacts that are unrelated to EEG features.
The "Z" indicates the trial number.
Each field is in the shape of channel_number*sample_number*frequency_bands, in other words, 62*W*5,
where W indicates the number of time windows in that trial (different
trials have different W because the film clips are not of the same length).
Below shows the architecture of one of the files.
-
The "eye_raw_data" folder contains raw data of the eye movement information recorded with the eye tracking glasses.
There are 5 files for each session, which are in the following form:
- {SubjectName}_{Date}_blink.mat
- {SubjectName}_{Date}_event.mat
- {SubjectName}_{Date}_fixation.mat
- {SubjectName}_{Date}_pupil.mat
- {SubjectName}_{Date}_saccade.mat
The description of each file is as follows.
-
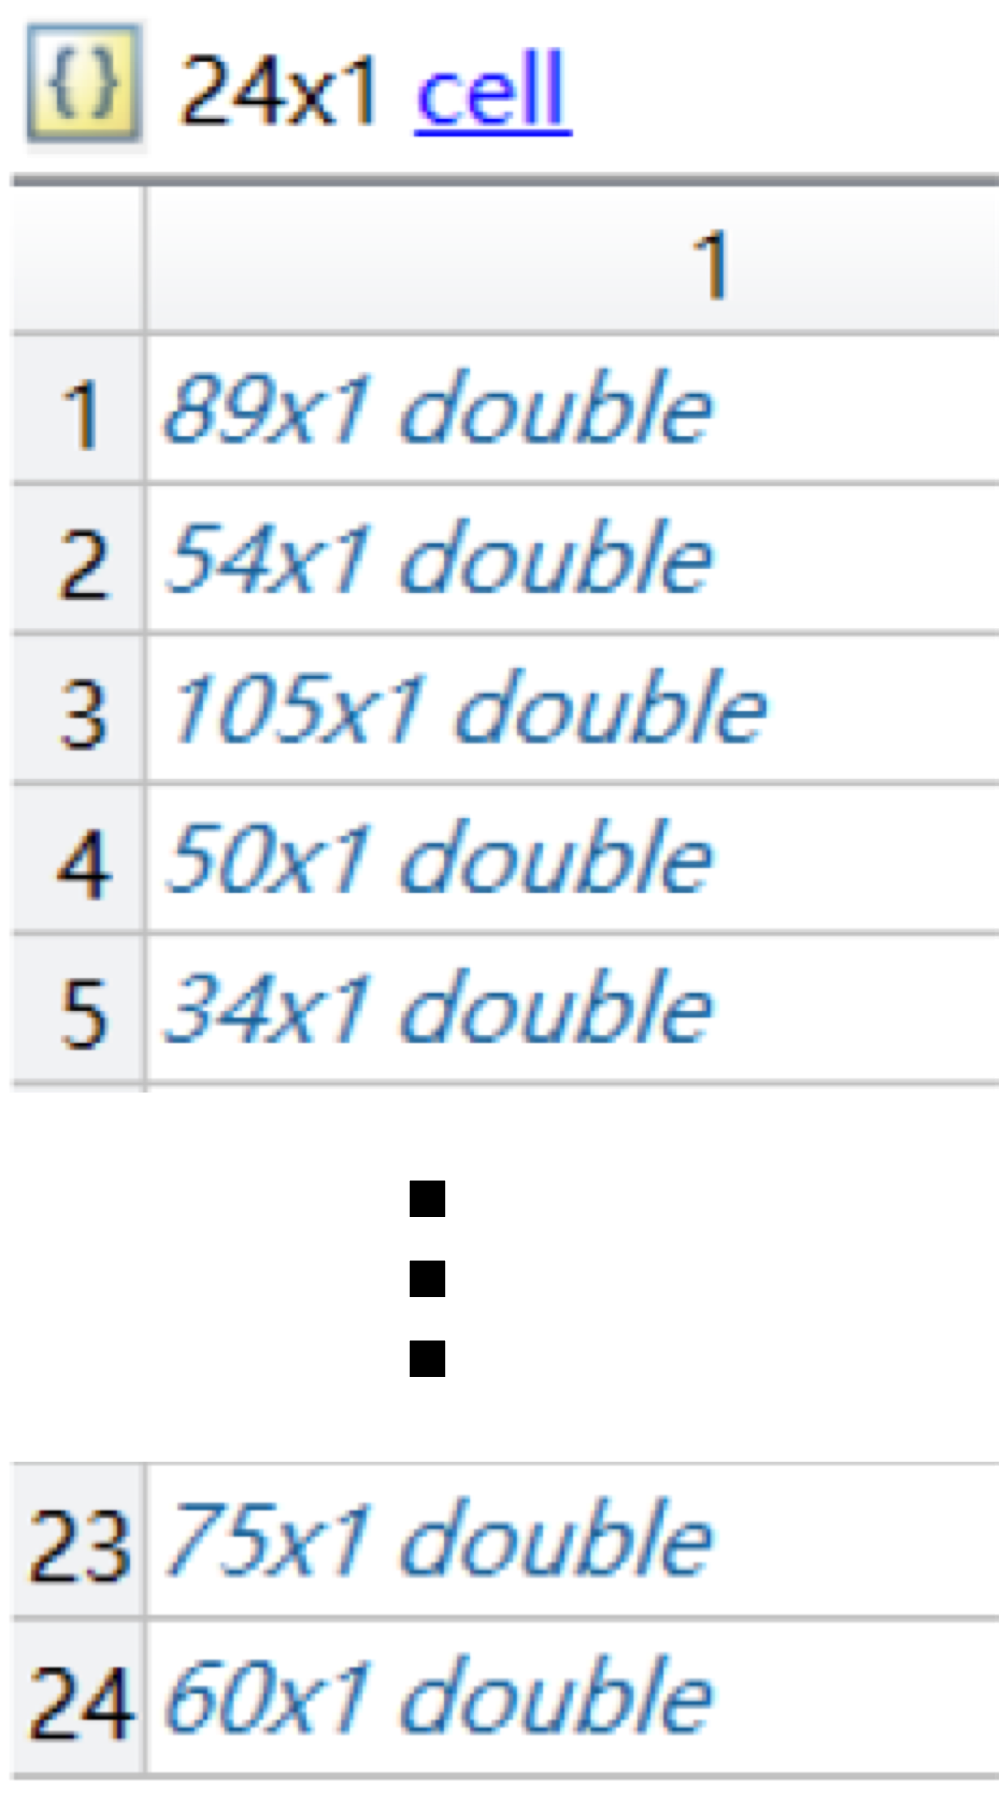
{SubjectName}_{Date}_blink.mat
The structure of one of the files is shown here.
It can be seen that there are 24 matrices in the file, corresponding to 24 movie clips. For example, in the first movie clip, 89 represents the number of blinks, and the data in this matrix represent the duration [ms] of each blink. In other words, the subject blinked 89 times, and each blink duration was recorded.
-
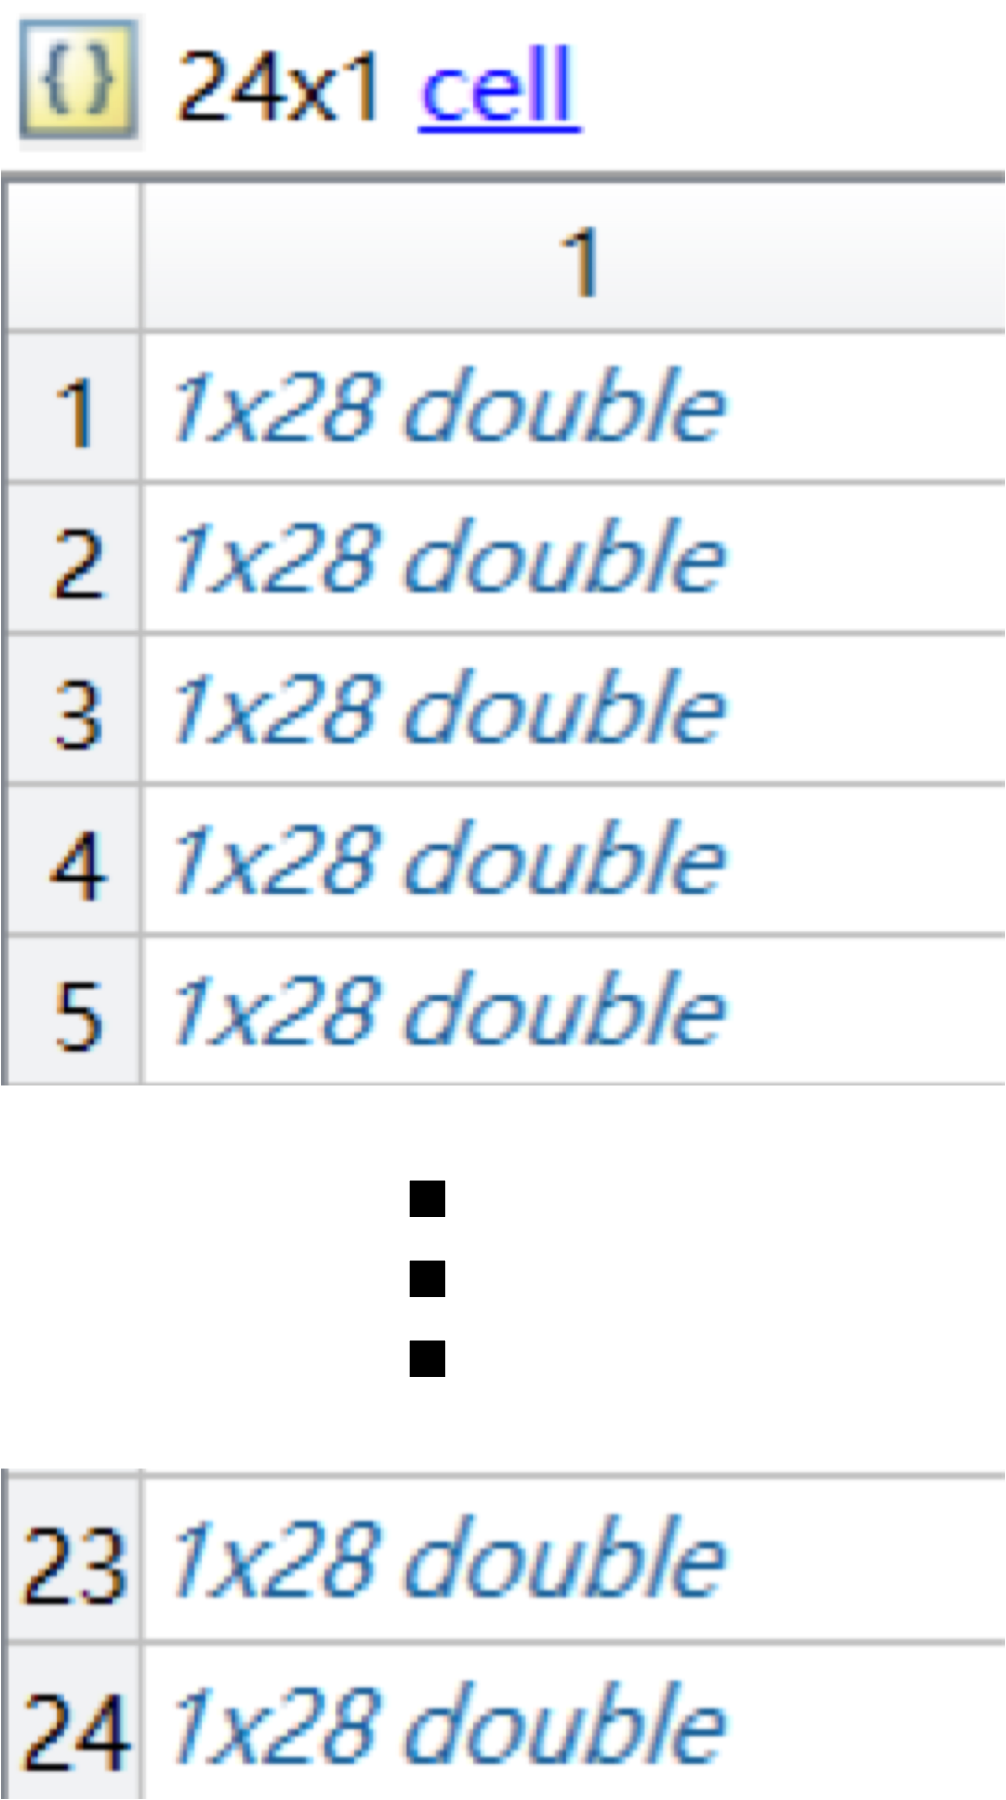
{SubjectName}_{Date}_event.mat
The structure of one of the files is shown here.
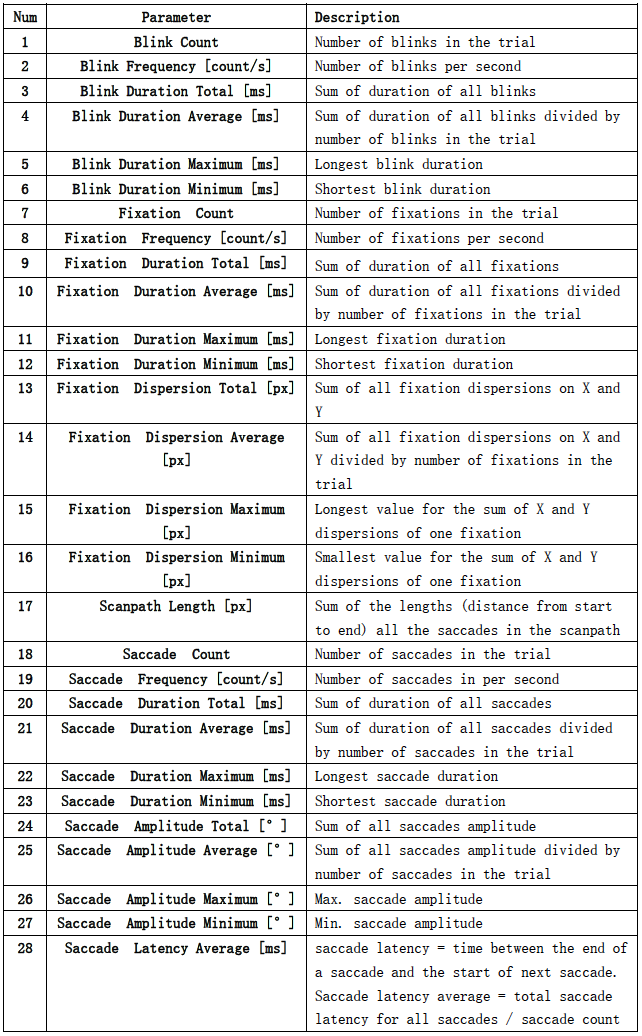
It can be seen that there are 24 matrices in the file, corresponding to 24 movie clips. 28 in each matrix represent 28 types of events, which can be found in the following table.
-
{SubjectName}_{Date}_fixation.mat
The structure of one of the files is shown here.
It can be seen that there are 24 matrices in the file, corresponding to 24 movie clips. For example, in the first movie clip, 439 represents the number of fixations, and the data in the matrix represent the fixation duration [ms].
-
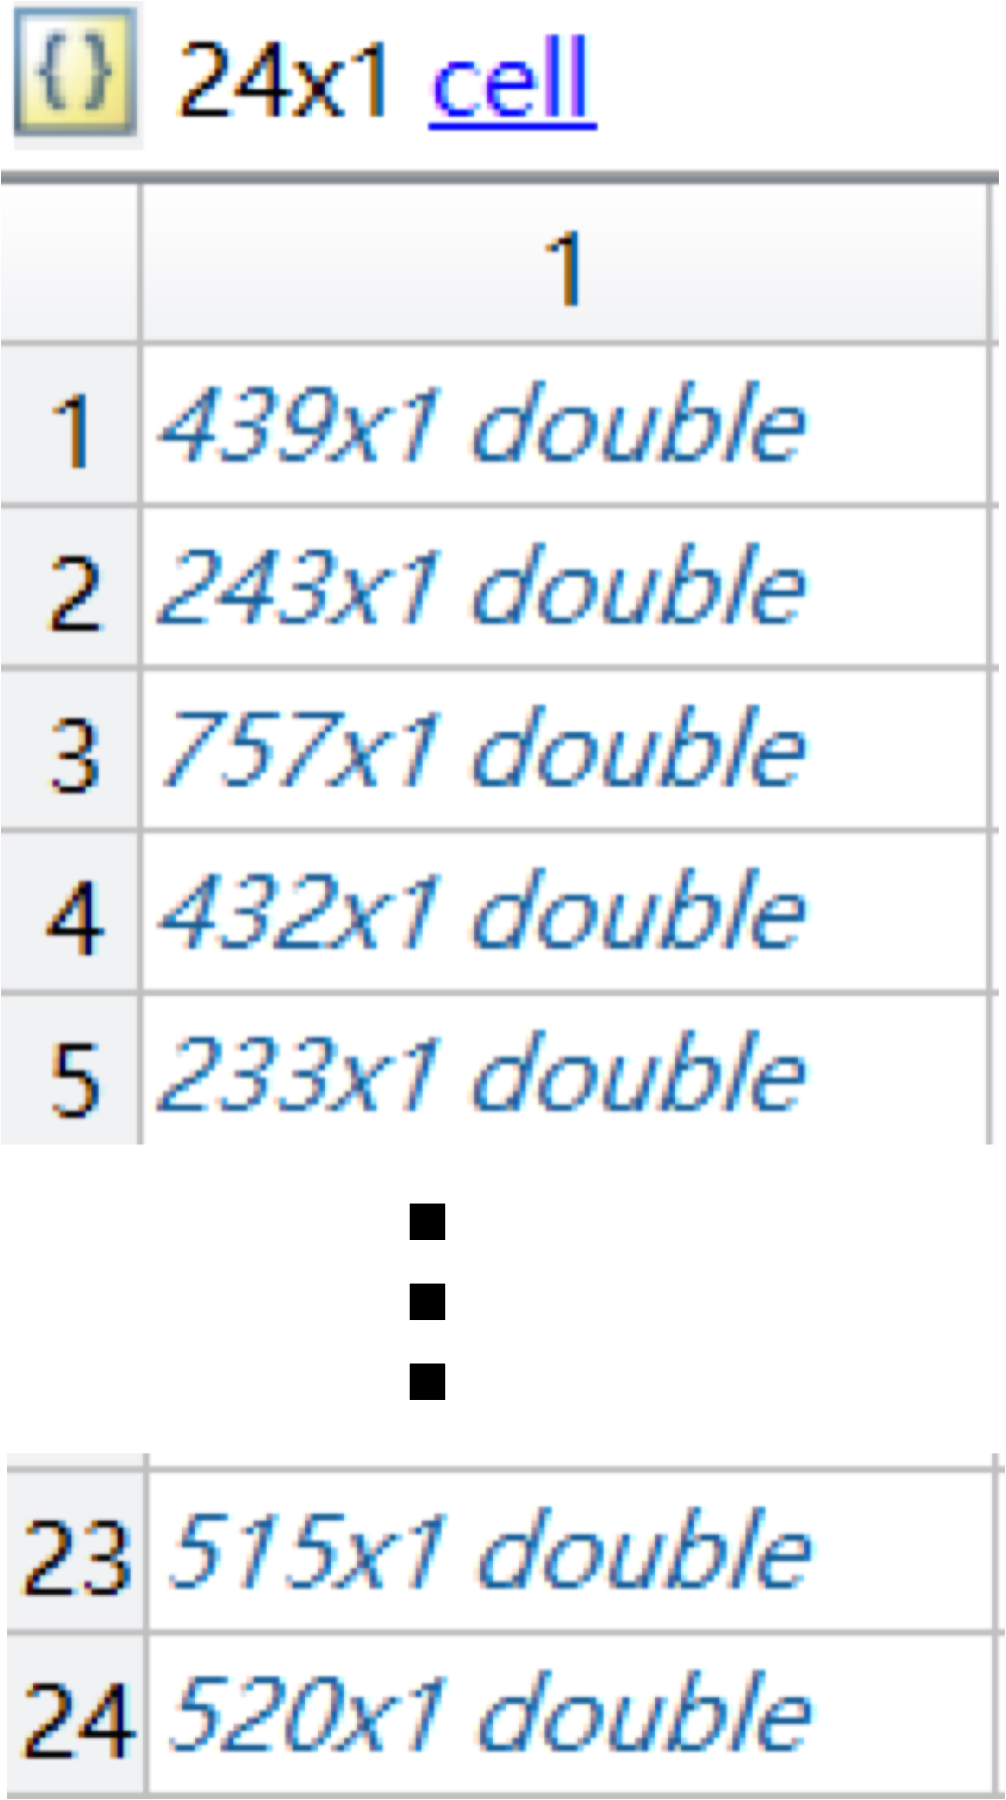
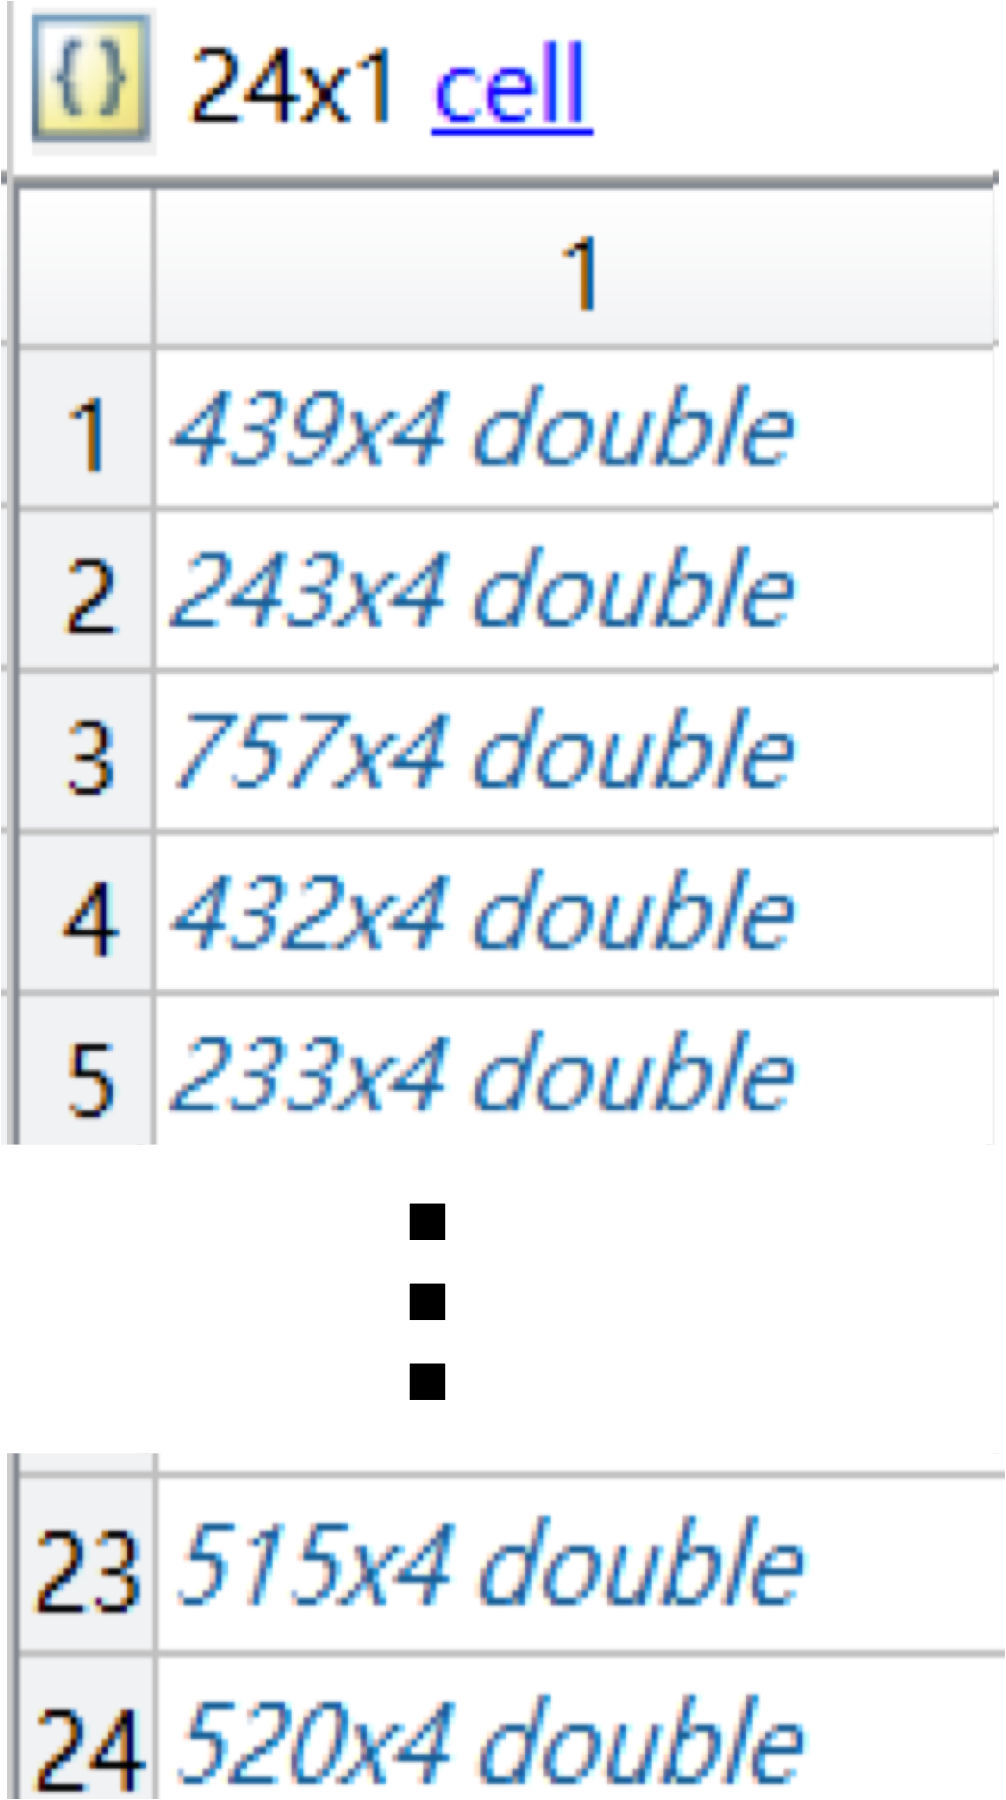
{SubjectName}_{Date}_pupil.mat
The structure of one of the files is shown here.
It can be seen that there are 24 matrices in the file, corresponding to 24 movie clips. For example, in the first film clip,
439 represents the number of pupil recordings, and
4 represents 4 features, namely, ‘Average Pupil Size [px] X’, ‘Average Pupil Size [px] Y’,
‘Dispersion X’ and ‘ Dispersion Y’, respectively.
-
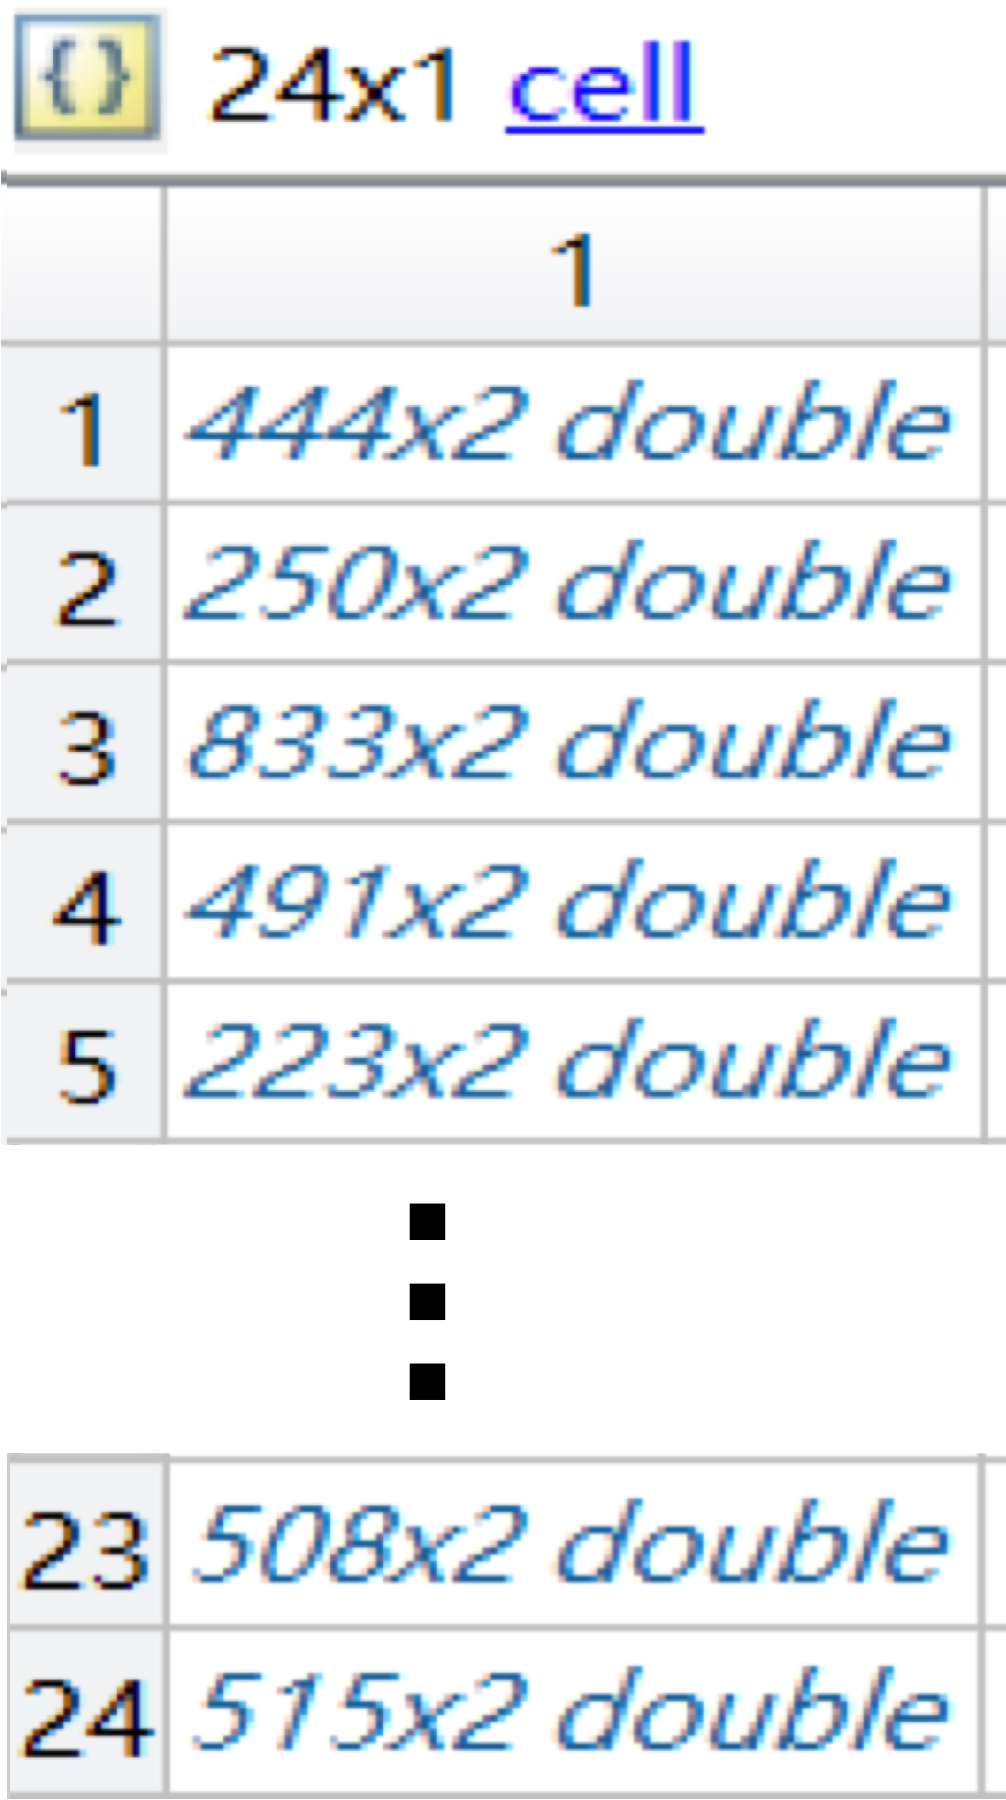
{SubjectName}_{Date}_saccade.mat
The structure of one of the files is shown here.
It can be seen that there are 24 matrices in the file, corresponding to 24 movie clips.
For example, in the first film clip,
444 represents the number of saccades and 2 represents 2 features: ‘Saccade Duration [ms]’ and ‘Amplitude [°]’.
-
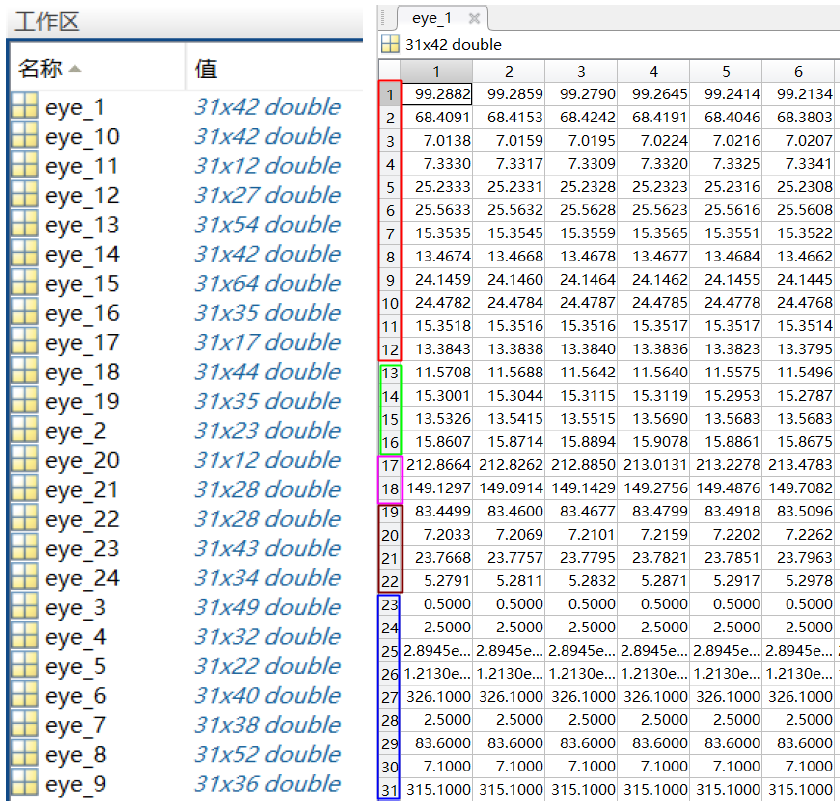
The "eye_feature_smooth" folder contains features extracted from the files in the eye_raw_data folder.
The naming of the files follows the "{SubjectName}_{date}.mat" formation. The structure of each file is
shown in the following figure.
The left part shows 24 fields; each field is for one session.
The right part shows the data matrix in one of the fields.
Each row corresponds to one type of feature, and each column corresponds to one data sample.
The relationship between the row number and the feature type is
-
1-12 : Pupil diameter (X and Y)
-
13-16: Dispersion (X and Y)
-
17-18: Fixation duration (ms)
-
19-22: Saccade
-
23-31: Event statistics
-
The "Channel Order.xlsx" file lists the channel names in the EEG placement figure in the order of
the channels in the EEG raw data provided in the "eeg_raw_data" folder.
-
The "ReadMe.txt" file demonstrates the label of each trial in each session and some other additional information.
Download
 Download SEED-IV
Reference
If you feel that the dataset is helpful for your study, please add the following references to your publications.
Wei-Long Zheng, Wei Liu, Yifei Lu, Bao-Liang Lu, and Andrzej Cichocki, EmotionMeter:
A Multimodal Framework for Recognizing Human Emotions. IEEE Transactions on Cybernetics, Volume: 49, Issue: 3, March 2019, Pages: 1110-1122, DOI: 10.1109/TCYB.2018.2797176.
[link]
[BibTex]